DeKalb County Fire Rescue (DCFR) Fire Risk Mitigation Project
The DeKalb County Fire Rescue (DCFR), an all-hazards emergency response agency protecting 735,000 residents over 260 square miles with over 700 full-time firefighters, is actively tackling the challenge of reducing risk to protect those who live, work, and play in DeKalb County, GA.
This task mostly had to rely upon historical and anecdotal insights to prioritize their risk mitigation efforts before the collaboration with ATLytiCS. We worked with their Appraisal and Planning Section, with a mix of sworn firefighters and civilian analysts, to help transform how they collect, analyze, and utilize data to evaluate their operations, justify their resources, and address emerging issues.
This collaboration aims to empower DCFR to focus on the right neighborhood, knock on the right doors, and share the right messaging based on their own data to help local community members avoid some of the behaviors and risk factors of having a fire in their home.
Their leadership team emphasized the importance of using data to drive decisions to both external and internal stakeholders. One of the first projects with them was developing a production-grade tool to achieve this goal.
The two steps taken to make this happen were:
- Using 5 years of fire incident data and publicly available datasets to develop a fire risk prediction model in Python to identify the highest risk neighborhoods.
- Developing an interactive R Shiny map and dynamic PowerBI dashboard allowing end-users to identify areas to focus on and data patterns to identify behavior change messaging.
Used 5 years of fire incident data and publicly available datasets
Resources such as the Census Bureau – American Community Survey (ACS) data, DeKalb County Tax Appraisal Parcel data, and CDC Social Vulnerability Index data were used. There were a number of previous open-source fire risk prediction projects to guide the identification of best practices, common problems, and next steps to rapidly move this project forward.
Ultimately, the team developed a series of successful models in Python to predict fires at the Census Tract level, Census Block Group level, and the tax parcel level.
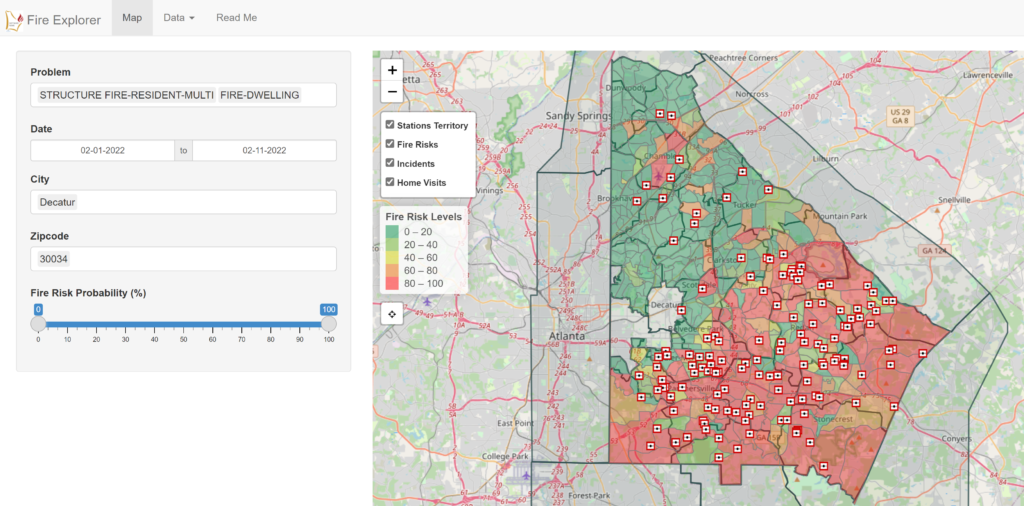
Developed an interactive R Shiny map to easily identify the highest risk block groups and parcels
The team also developed a Power BI dashboard for internal purposes while developing templates for resident-focused infographics. This dynamic Power BI dashboard allows end users to drill down into their own data to identify data patterns, such as more common months of the year, or even hours in the day for fires. The tool allows the user to select any variable of interest—such as cooking fires—and all of the other data charts dynamically change based upon those user selected filters.
The dashboard below shows the Fire Explorer tool with all the parameters.

Taken together, the map and the Power BI dashboard are intended to encourage and facilitate end users—operational DCFR personnel—with limited data expertise to be able to explore their own data, identify patterns they can focus on, and identify the highest priority areas to focus on.
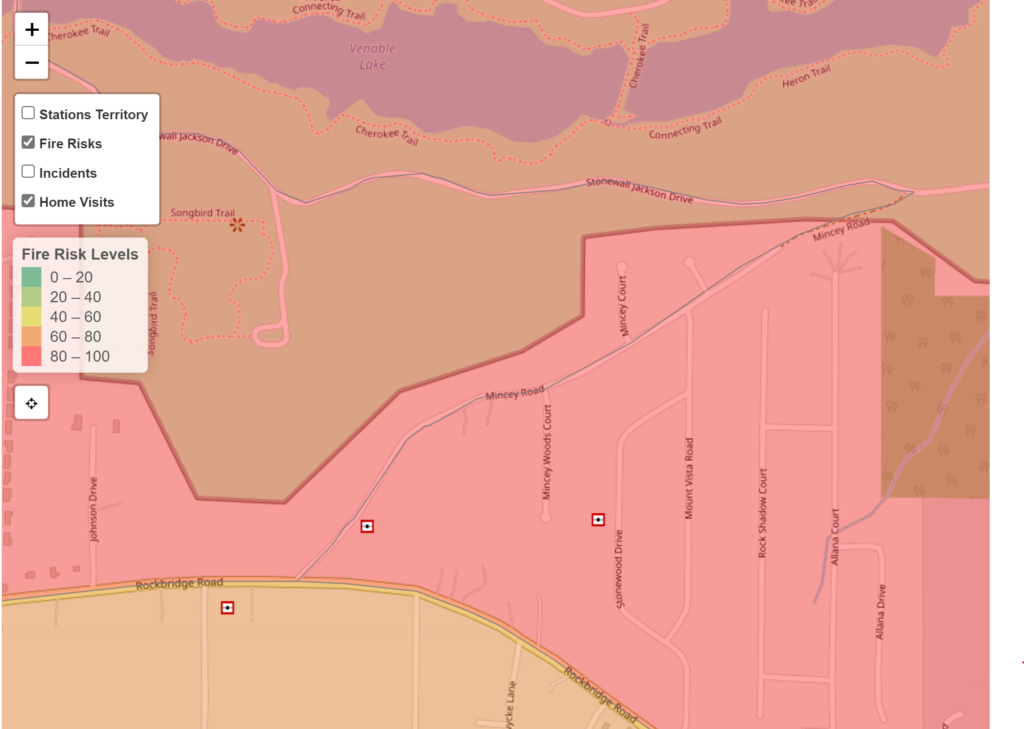
As shown below, home visits [marked with ‘+’] were completed on the days of high ‘Fire Risks’.

DCFR is currently gaining value from the tools by using them to aid in American Red Cross Smoke Alarm distribution and DCFR smoke alarm distribution. The model was the impetus to request additional funding for smoke alarms targeting high risk areas. DCFR is presenting the model, tool, and findings at the 2022 International Association of Fire Chiefs Community Risk Reduction Conference in May 2022 in Toronto, Canada.
