ASI – Water Planning & Stewardship
The objective of our project was to create a tool to show water consumption and contamination across Georgia at the county level.
We wanted this tool to enable the development of insights into water stewardship and management by:
- identifying counties that are most vulnerable in terms of socio-economic status;
- exploring water consumption based on location and population;
- investigating the most common contaminants;
- visualizing the location and level of contaminants and whether these change based on an area’s demographic composition.
The datasets we analyzed contain underprivileged groups of people, water distribution, and the quality of water based on geographical region.
Identifying Most Vulnerable Counties
We used the CDC’s Social Vulnerability Index (SVI) which uses US Census data to help local officials identify communities that may need support during natural disasters to measure the vulnerability of each county.
SVI is categorized into four themes based on: socioeconomic status, household composition, race/ethnicity/language, and housing/transportation. Percentile ranking values range from 0-1: the higher the score, the higher the vulnerability. To understand the change in water consumption over time, we used the United States Geological Survey Water Use Data from 1995 to 2005, measured at the county level in Georgia.
The Most Common Contaminants
To understand the level of each water contaminant across Georgia, we used the Unregulated Contaminant Occurrence Data, which collects 30 contaminants during the monitoring of public water systems.
Investigating the most common contaminants across Georgia led us to HAA6Br, HAA5, and HAA9 as the three contaminants most frequently present in the water, followed by anatoxin-a, cylindrospermopsin, total microcystin, manganese, germanium, 1-butanol, and 2-methoxyethanol. While the severity of each contaminant varies, it is important to recognize the harmful impacts of these pollutants on a community’s water supply. For example, manganese is more than a nuisance contaminant that can cause water discoloration, staining of fabrics, foul water taste, and smell but can also be harmful to children and infants as they can’t digest toxins as adults can.
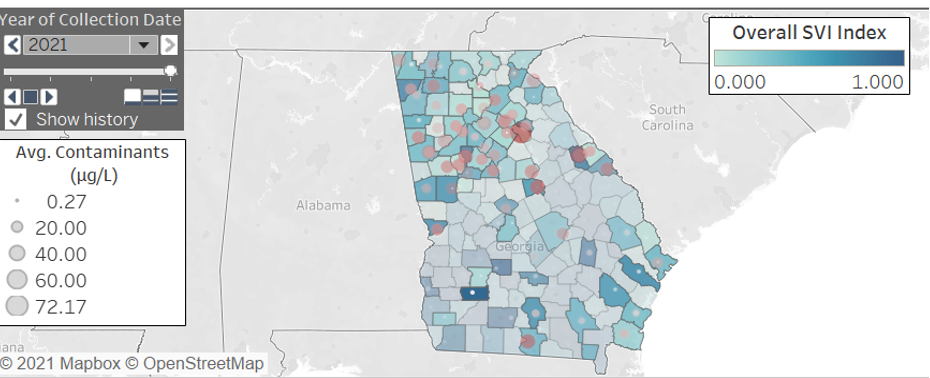
Visualizing Contaminants by Location
We used Tableau to develop our visualization tool. Users can click on a county to see its SVI by theme and water contaminant composition. We hope stakeholders can use our dashboard to understand contaminants across Georgia.